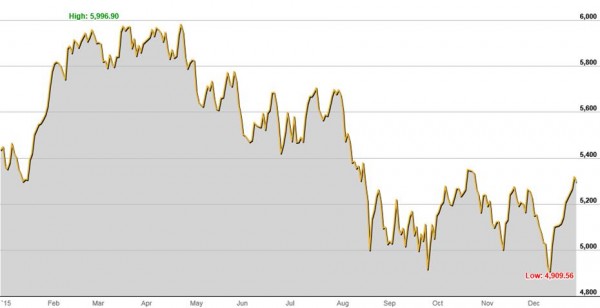
The Australian share market sent investors on a rollercoaster ride in 2015, with the benchmark S&P/ASX 200 Accumulation Index (including dividends) rising 2.56% for the year, whereas the S&P/ASX 200 Price Index (excluding dividends) lost -2.13% for the year.
From a high of just under 6,000 points in April the market fell as low as 4,910 in December before rebounding to finish the year marginally below 5,300 points, as shown in the chart below.
From a sector and stock level, the ride was even more wild in 2015. The materials sector lost -15.2% and the energy sector lost -27.7%. The two best performing sectors were consumer discretionary up 18.7% and utilities up 22.8%.
Best and Worst Performers
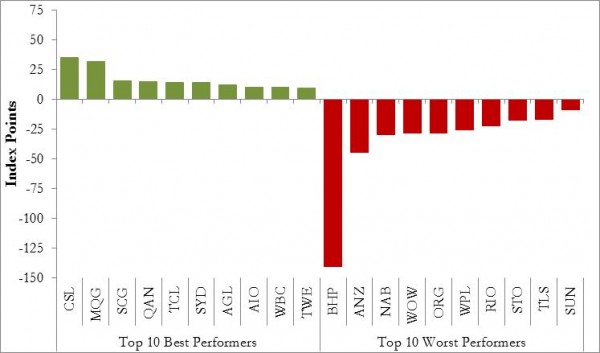
Looking at individual stocks, CSL added the largest contribution (in terms of points) to the index followed by Macquarie Bank. The worst performing stock was BHP which wiped out the collective contribution of the top 7 performing stocks in the Australian market. BHP was Australia’s largest company and it has now fallen to the sixth largest, behind the big four banks and Telstra. Interestingly ANZ and NAB were also amongst the worst performers behind BHP in 2015.
These charts are a reminder of how concentrated the Australian share market is, with the top 10 stocks representing 50% of the total market capitalisation. The lack of diversification and cyclical nature of the Australian market (with 65% represented by financials, materials, and energy stocks) means that investors need to brace for volatility. Dividends are only one part of the total investment return, and investors need to consider the capital growth (or lack thereof) side of the equation.
Contact Us
If you would like more information or a review of your current portfolio then we’re only too happy to help. Talk to one of our Private Wealth Advisors today.


